Analytics and Management Reporting using f4b
Users design their own reports based on the data available to them. Simple query design tools make aggregating your data for analytics fast, easy and reliable. 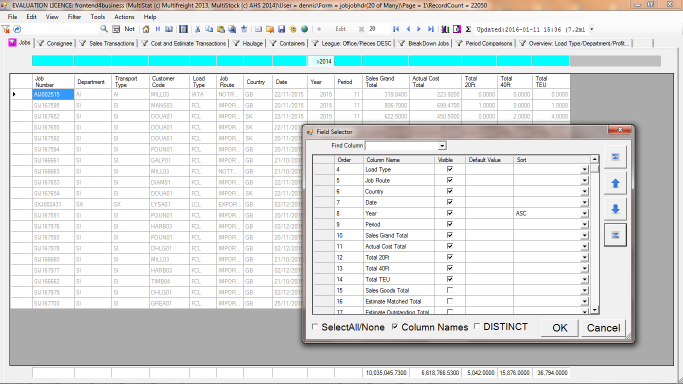
Select records and fields for totalling, sorting and aggregate reporting. Optionally save your settings for scheduled emailing etc.
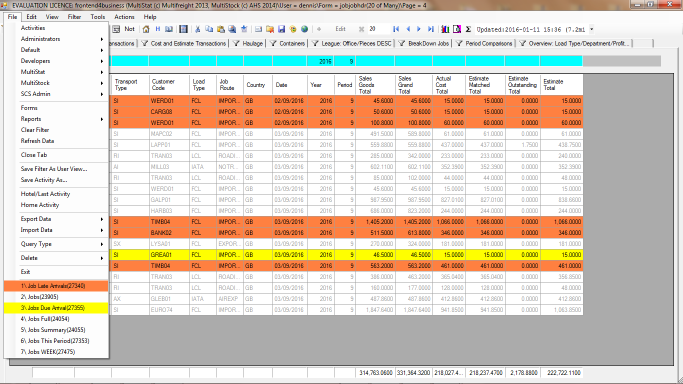
Easy to set up and use conditional formatting. Red screens around the office tells you what is happening in real time.
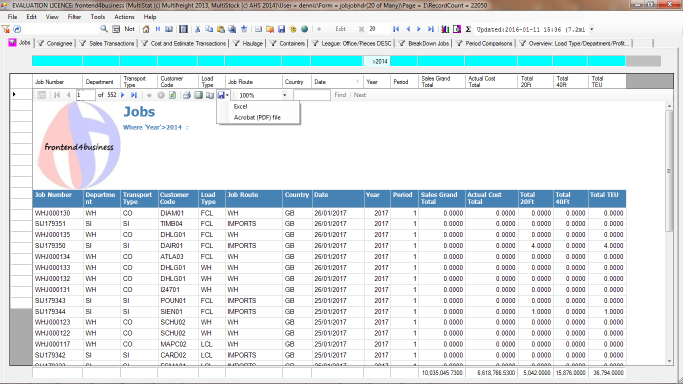
From grid to report is one click. The export data is available on all tabs.
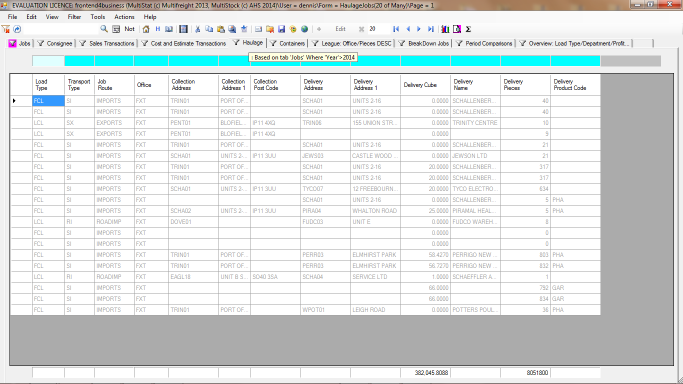
Adjacent tabs provide drill down to detail records.
Aggregating your data.
The field selector changes to match the way you view your data.
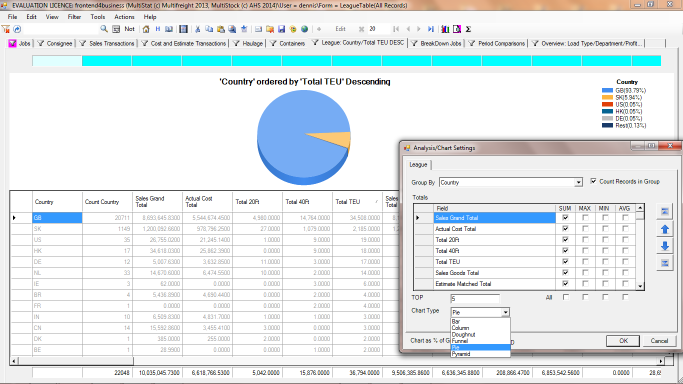
League table analysis, click a column header to change the chart, click a row to see a slice.
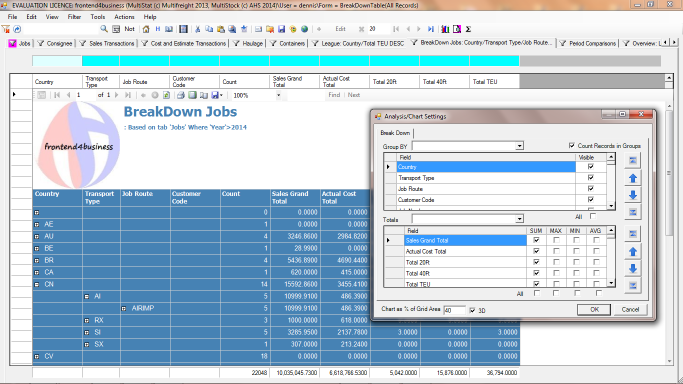
Selecting Group by fields for Breakdown reporting.
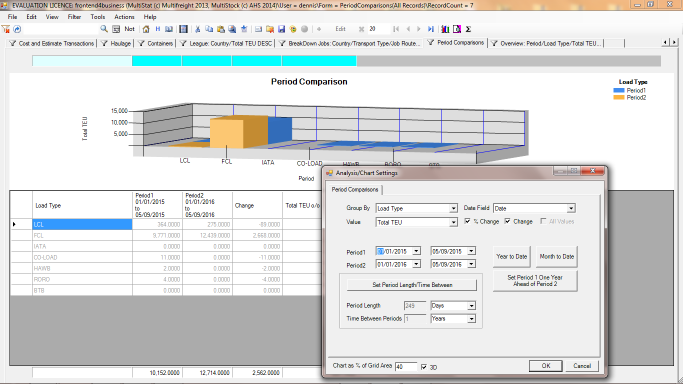
Selecting fields for period comparision.
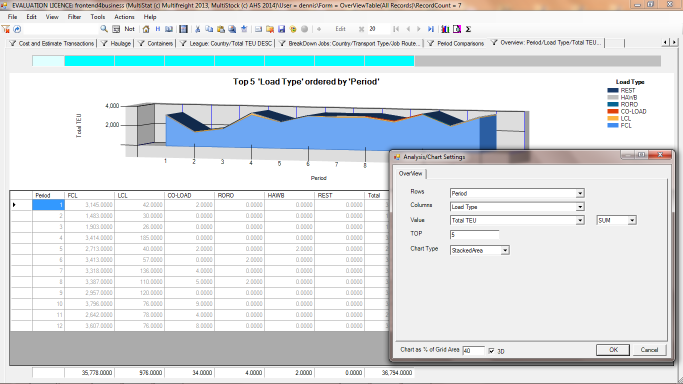
Selecting fields for cross tabulation reporting.
| 


